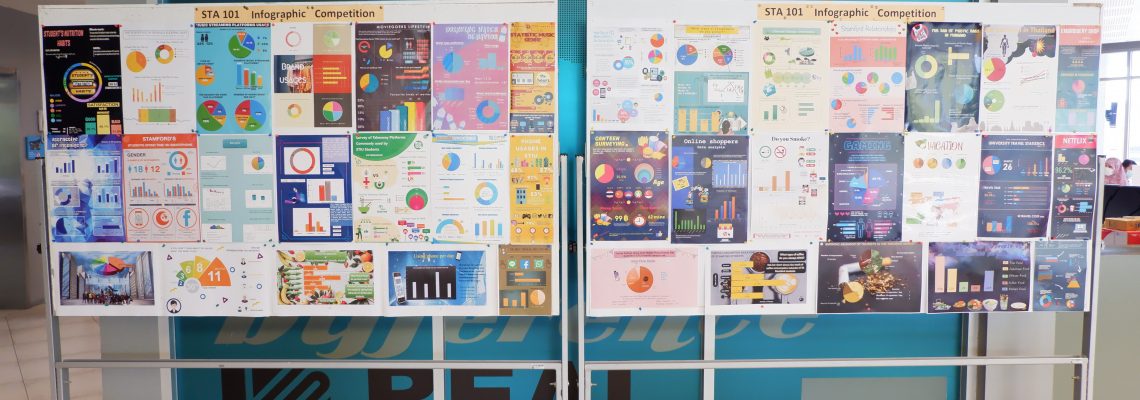
Students learn a variety of concepts in STA 101, including: (a) classification of variables and different levels of measurement in order to apply the proper statistical methods, (b) describe data using a variety of statistical methods and charts such as bar charts, pie charts, line charts, dot plots, and box plots in order to find patterns and trends in the data collected, (c) compute and interpret basic descriptive statistics both manually and using Microsoft Excel in order to analyze the data set, (d) compute and interpret various measures of variability such as range and standard deviation in order to recognize the shape of the data set and be able to analyze it in more detail, (e) identify and compute different types of probability distributions in order to be able to use these concepts in sampling methods, (f) identify different types of sampling methods in order to analyze population parameters, (g) compute, interpret and report a point estimate and a confidence interval for different population parameters in order to make competent and scientific decisions, and finally (f) present data analysis in proper format.
The competition is designed to (a) help students understand the practical application of the theoretical concepts learned in the Introduction to Statistics course, (b) prepare the student to attain an understanding of the concepts in practice, which will help them in the next follow up course, i.e, Business Statistics, (c) show and encourage the learners to learn to work as a team, and (d) create an enjoyable learning environment for student learning to take place.


